Report to Make the SaaS
Contract Renewals Fast
Speeding Contract
Renewals for SaaS
Customers spent 5+ days on reports to track savings from FourKites, a very time consuming task for contract renewals.
Problem
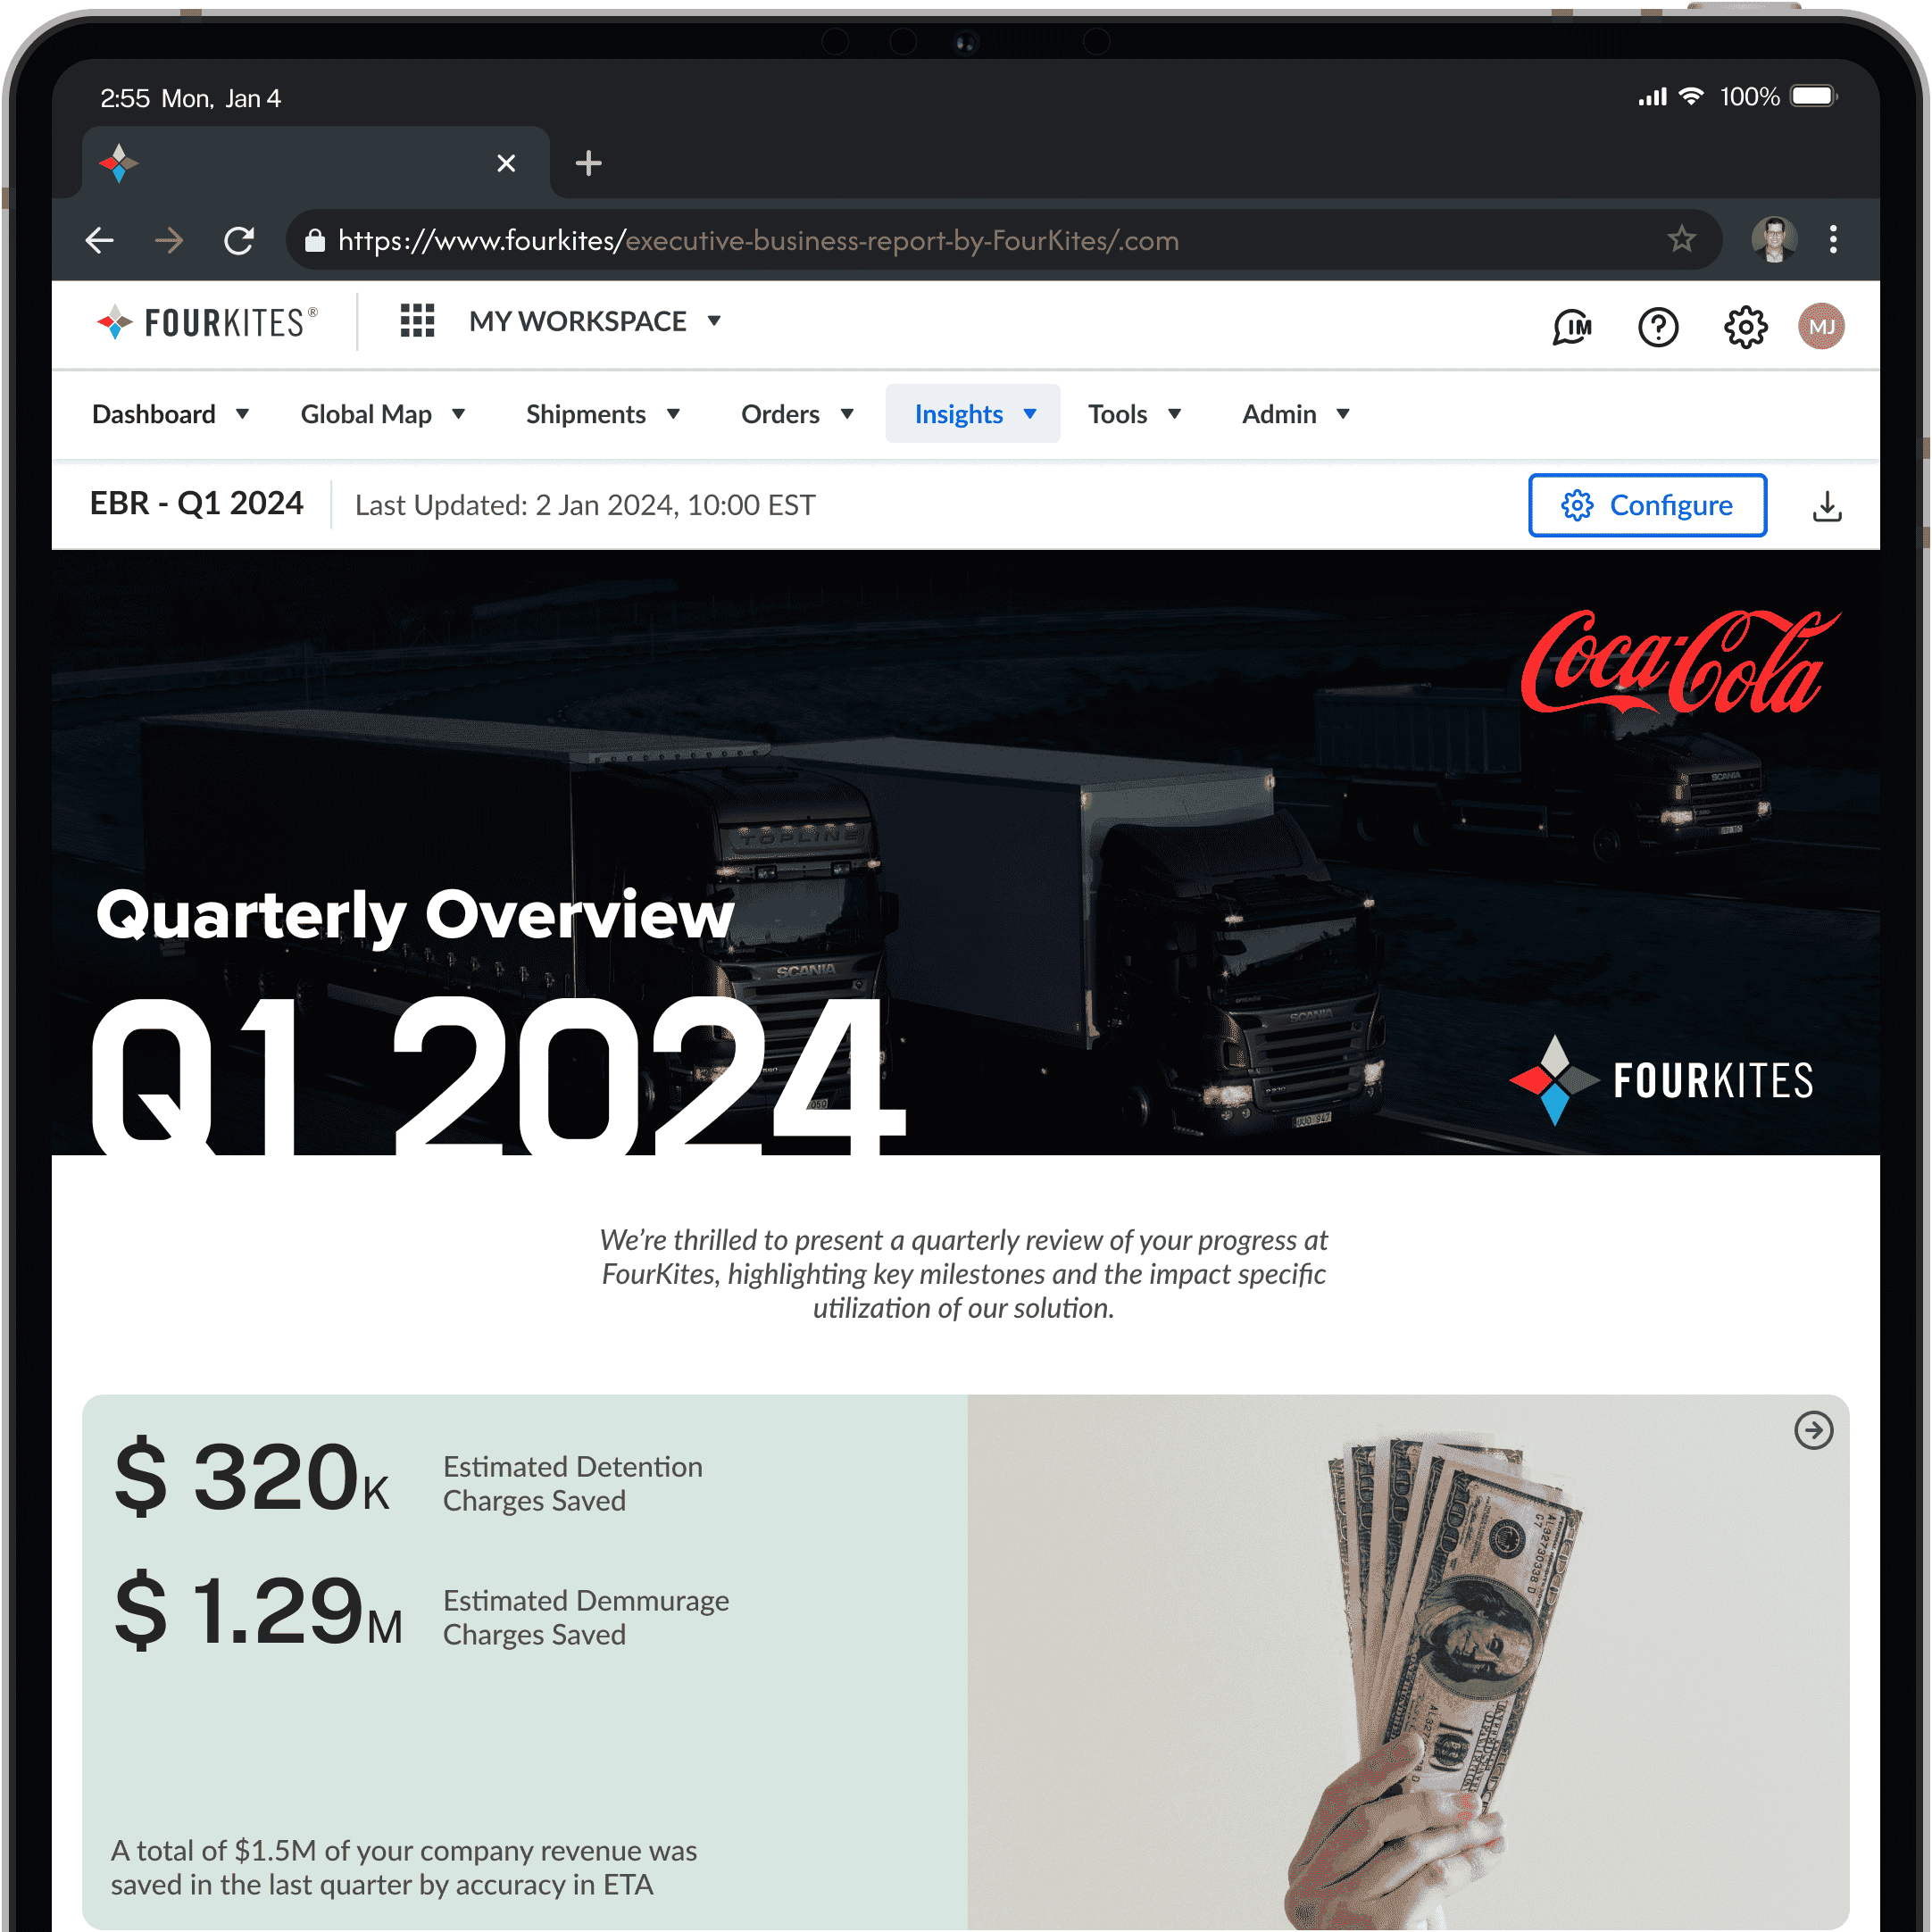
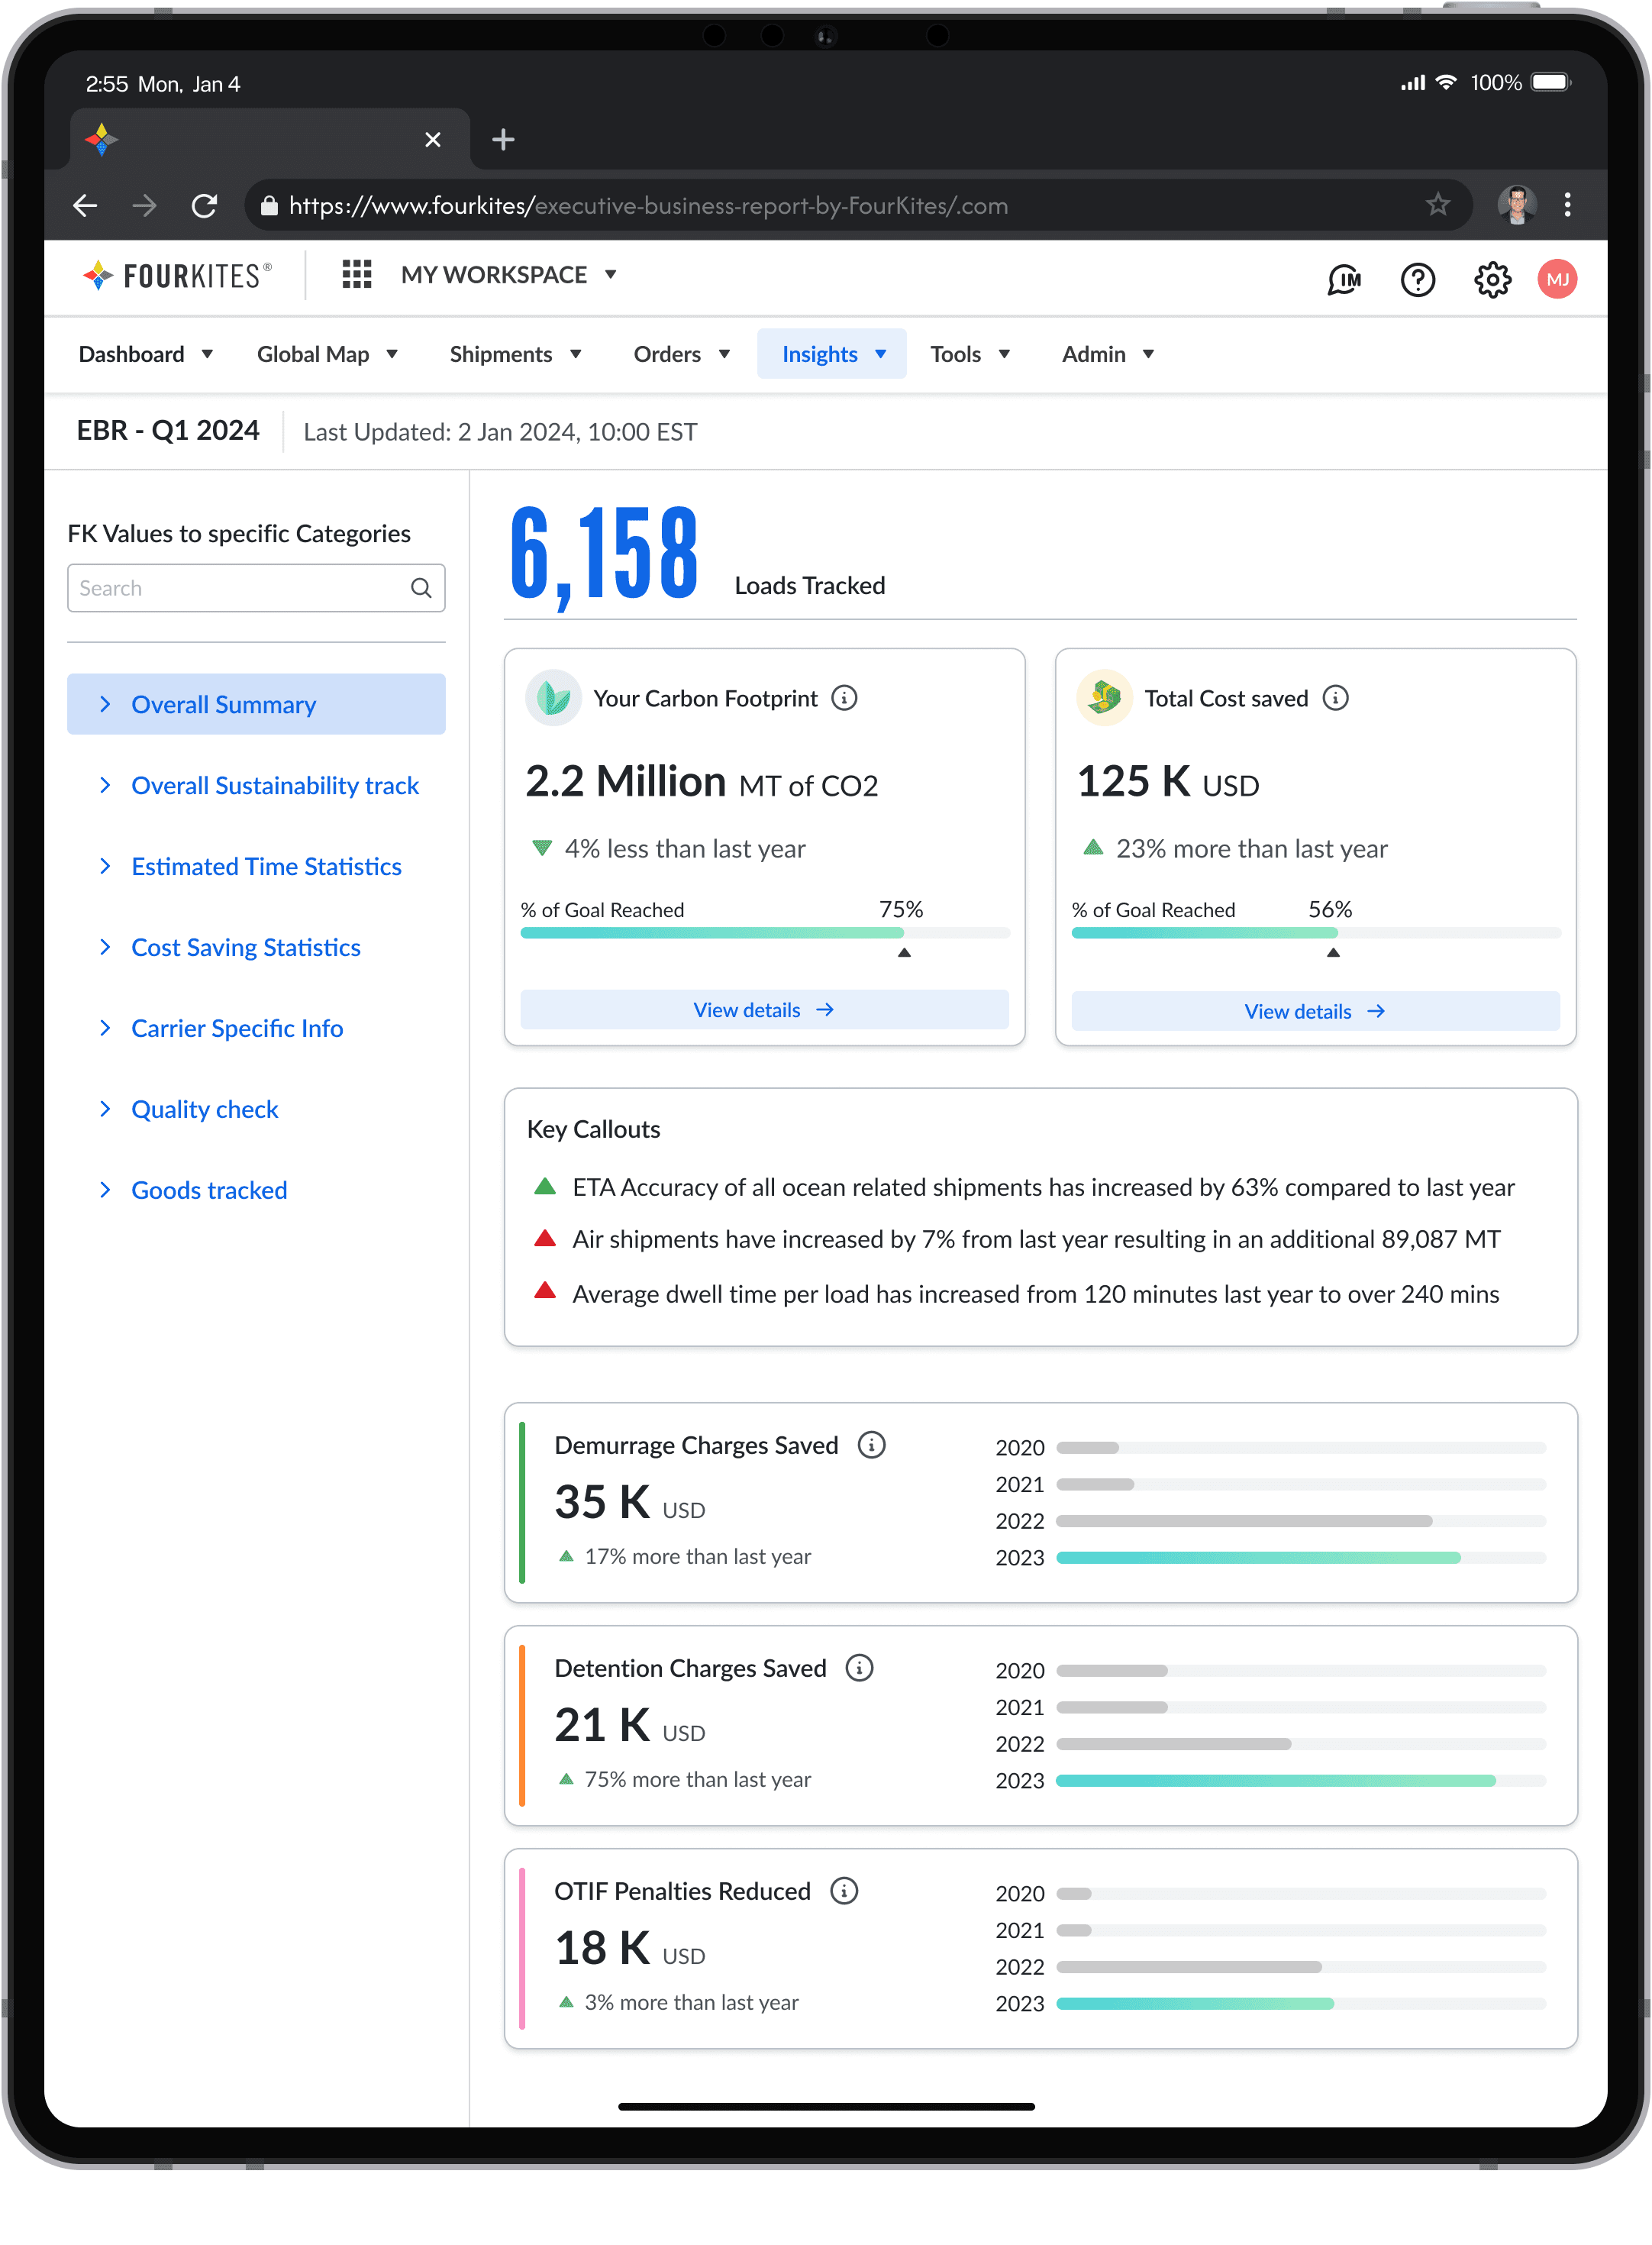
Replaced the 8-page manual report with a 2-page A.I. powered automated email.
Solution
Reduced contract renewal time from 6 days to 2 days.
Impacts
2 weeks (Final release in Feb - 2024)
Duration
Rohit Menon (Sr. UXD) Nalina S (UXD) Me (UXD)
My Team
Product research / Visual and UI design / UX writer.
My Roles
Customers spent 5+ days on reports to track savings from FourKites, a very time consuming task for contract renewals.
Problem
Replaced the 8-page manual report with a 2-page A.I. powered automated email.
Solution
Reduced contract renewal time from 6 days to 2 days.
Impacts
2 weeks (Final release in Feb - 2024)
Duration
Rohit Menon (Sr. UXD) Nalina S (UXD) Me (UXD)
My Team
Product research / Visual and UI design / UX writer.
My Roles
Customers spent 5+ days on just few reports to assess savings from FourKites , a very time consuming task for contract renewals.
Problem
Replaced the 8-page manual report with a 2-page automated email, reducing the overall contract renewal time from 6 days to 2.
Solution and Impacts
2 weeks (Final release in Feb - 2024)
Duration
Research / Visual and UI design / UX writer.
My Roles

Problems experienced, but not noticed
Problems experienced, but not noticed
Problems experienced, but not noticed
Problem statement
Customers of FourKites spent over 3+ days each quarter collecting data from various sources to create reports. The insights screen, which gave 80% of the crucial data, helps users gather over 200 data points for this reports. This immense time-taking process and the manual efforts delayed the renewal decisions.
Problem statement
FourKites's customers spent over 3+ days per quarter collecting data for reports. The major insights screen, providing 80% of the crucial data, streamlined 200+ data points together but delayed renewal decisions.
Switch to PC/Tab to know the design process
Switch to PC/Tab to know the design process
Switch to PC/Tab to know the design process
Switch to PC/Tab to know the design process
Delay
Slowed down critical business decisions.
Delay
Slowed down critical business decisions.
Delay
Slowed down critical business decisions.
Fault
Increased risk of inaccurate data analysis.
Fault
Increased risk of inaccurate data analysis.
Fault
Increased risk of inaccurate data analysis.
Business
Delay causes missed business deals.
Business
Delay causes missed business deals.
Business
Delay causes missed business deals.
Resources
Diverts the resources from other tasks.
Resources
Diverts the resources from other tasks.
Resources
Diverts the resources from other tasks.
Expectations and aim of the project
Expectations and aim of the project
Expectations and aim of the project
Aim for the design
We aimed to accelerate the contract renewals and reduce manual effort through an optimized Insights dashboard, enabling faster, data-driven decisions.
Aim for the design
We aimed to accelerate the contract renewals and reduce manual effort through an optimized Insights dashboard, enabling faster, data-driven decisions.
Aim for the design
We aimed to accelerate the contract renewal and reduce manual effort through optimized dashboard, enabling faster decisions.
We set up a 3 day renewal target to ensure renewal.
This number was set as our customer calls typically started in 3 to 4 days post expiry.
We set up a 3 day renewal target to ensure renewal.
This number was set as our customer calls typically started in 3 to 4 days post expiry.
We set up a 3 day renewal target.
This number was set as our general customer calls started in 3 to 4 days post expiry.
Identified issues in current process
Identified issues in current process
Identified issues in current process
Process to create the report
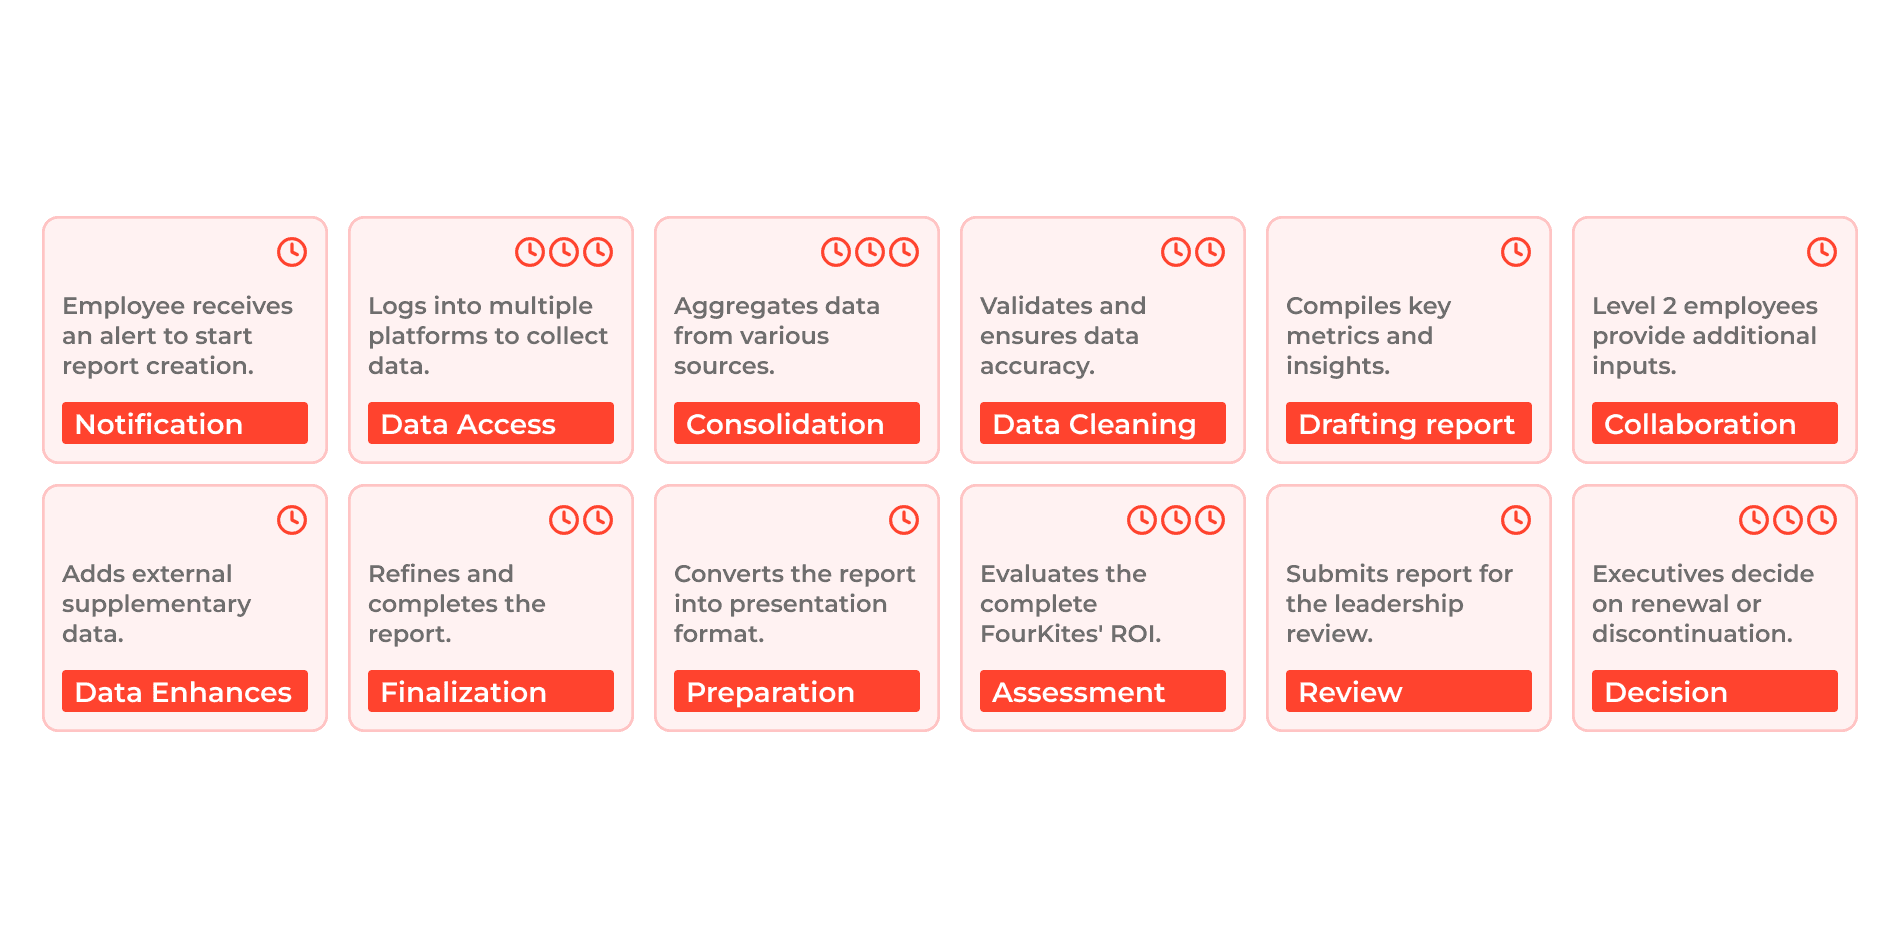
I noted down the report creation flow by interviewing 4 users and PM to understand the customer’s process, steps, and post-report actions.
Process to create the report
I noted down the report creation flow by interviewing 4 users and PM to understand the customer’s process, steps, and post-report actions.
Process to create the report
I noted down the report creation flow by interviewing 4 users and PM to understand the customer’s process, steps, and post-report actions.
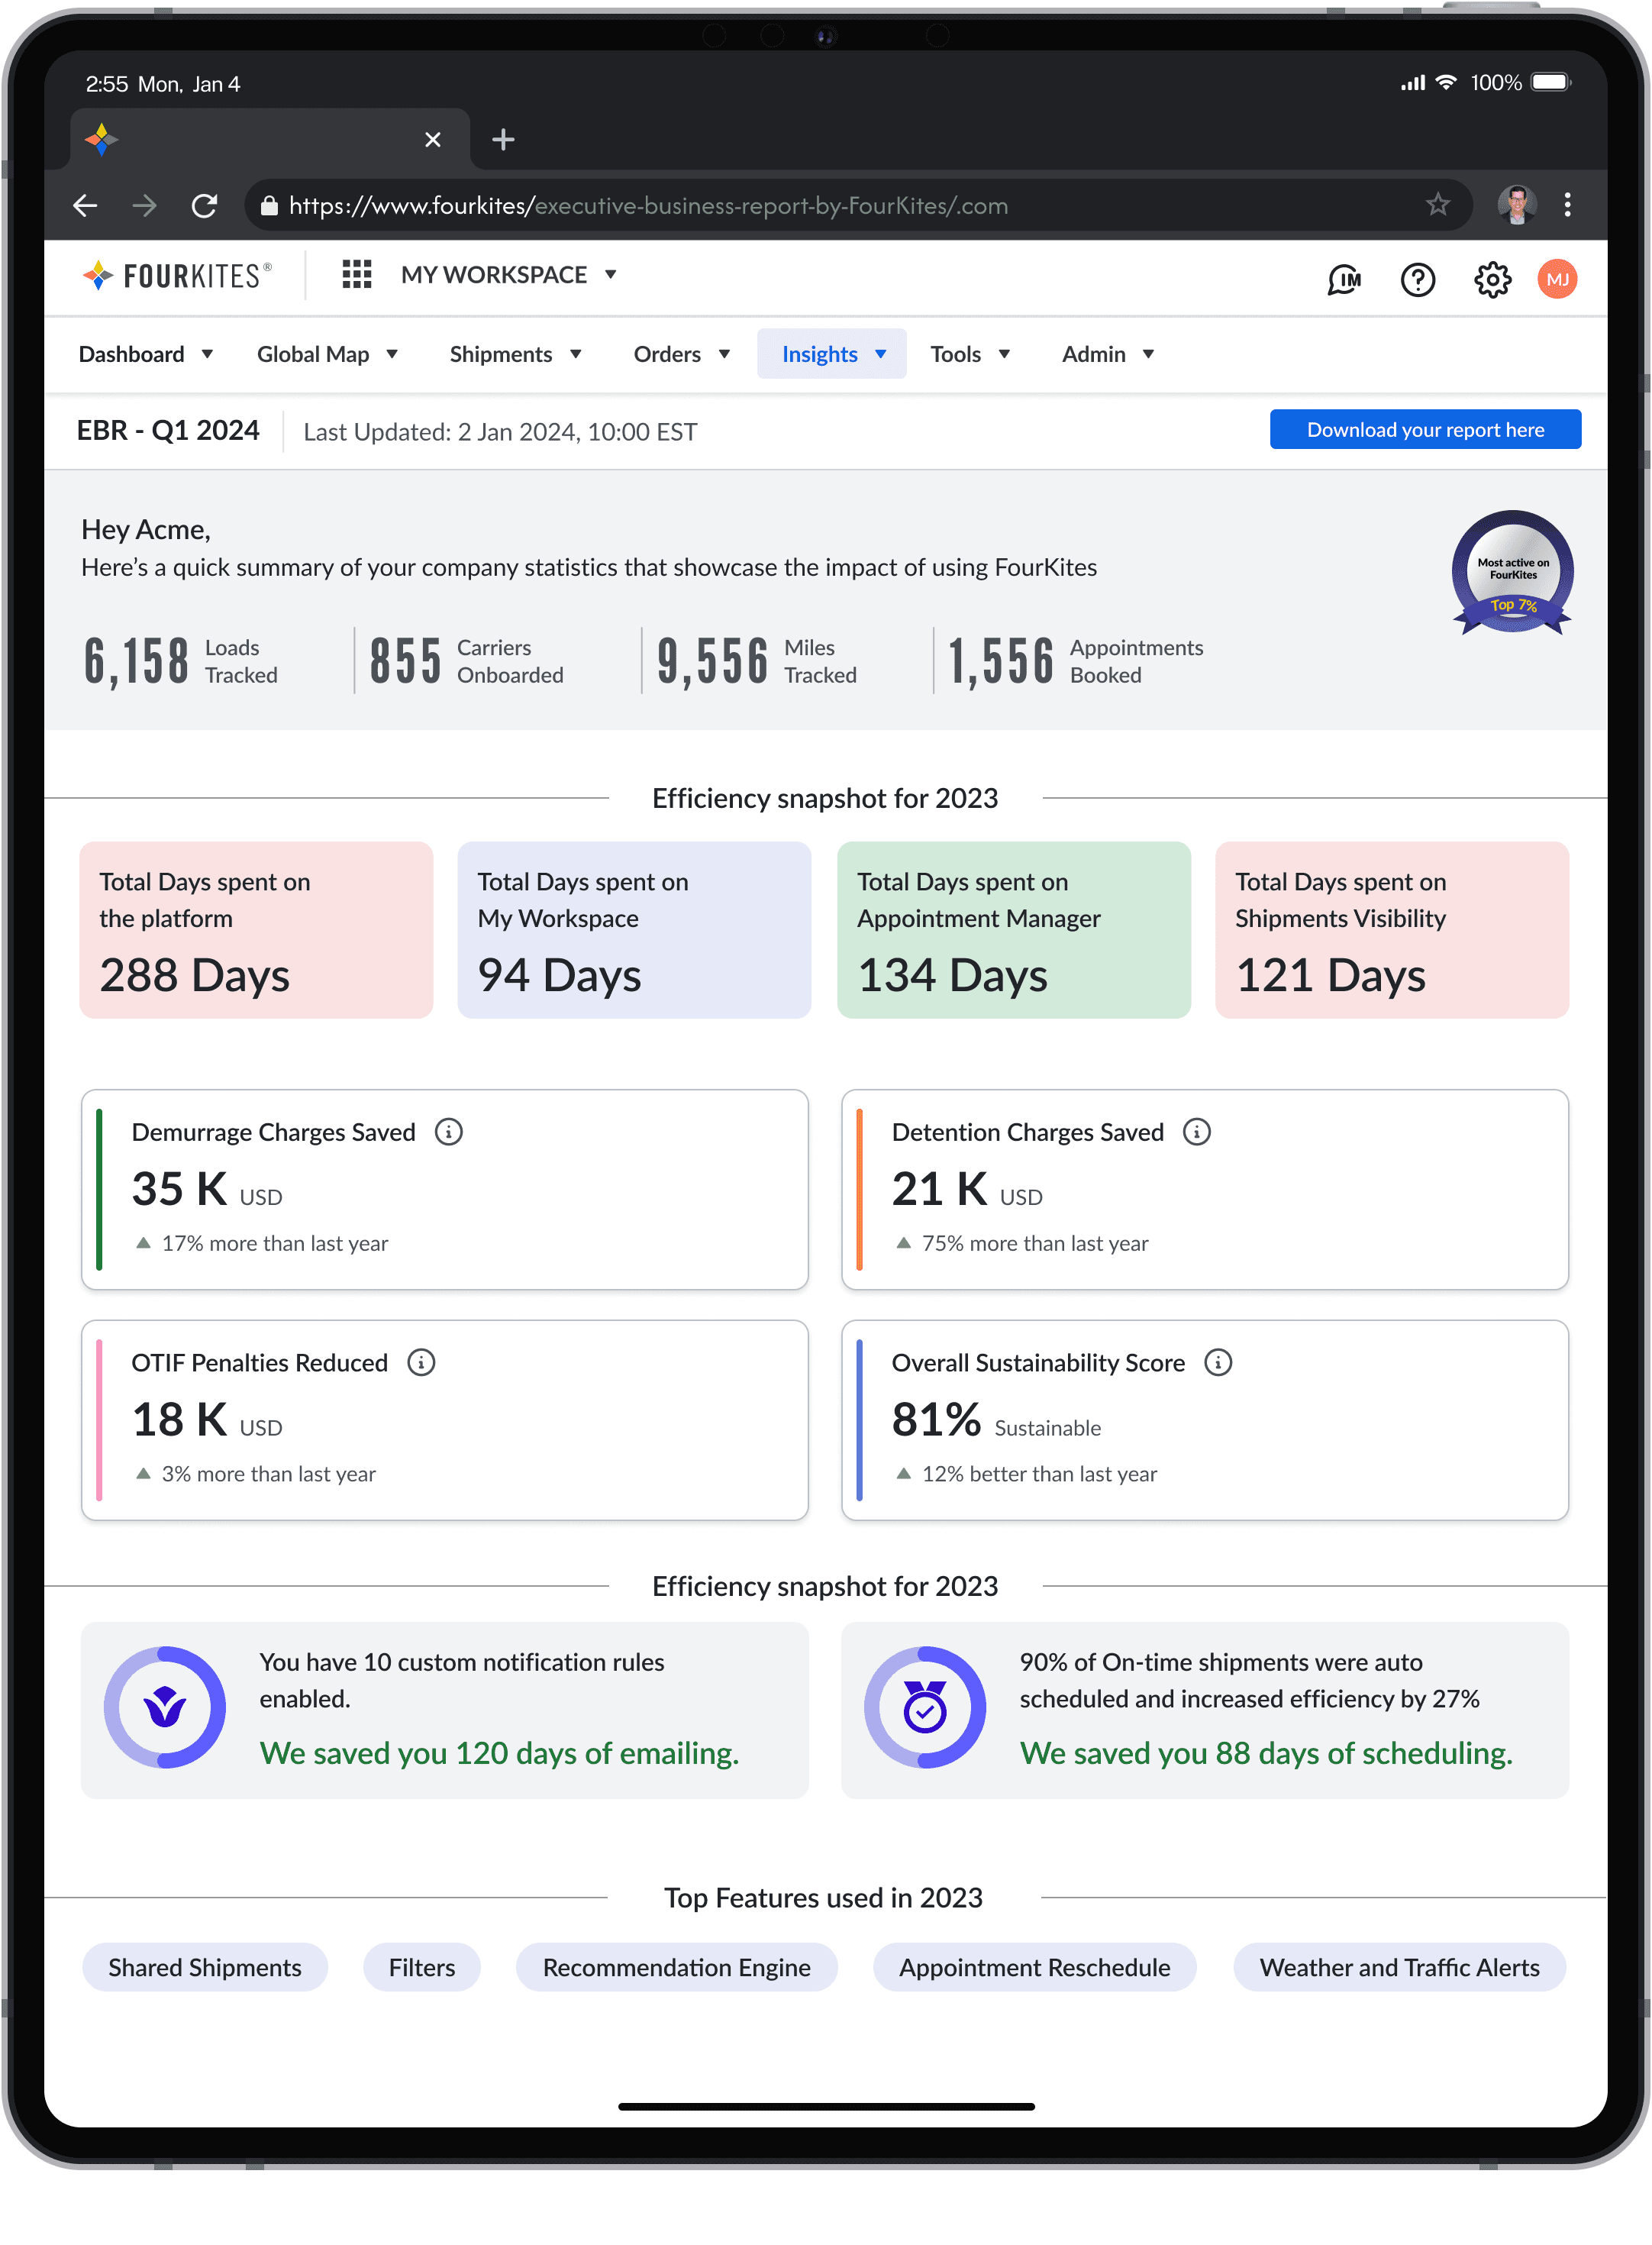
Existing insights page
Me and the second UXD decided to point out all the issues that were blocking the aim and goals the team wanted to achieve. These issues needed be resolved in new design to create the initial design iteration.
Existing insights page
Me and the second UXD decided to point out all the issues that were blocking the aim and goals the team wanted to achieve. These issues needed be resolved in new design to create the initial design iteration.
Existing insights page
Me and the second UXD decided to point out all the issues that were blocking the aim and goals the team wanted to achieve. These issues needed be resolved in new design to create the initial design iteration.
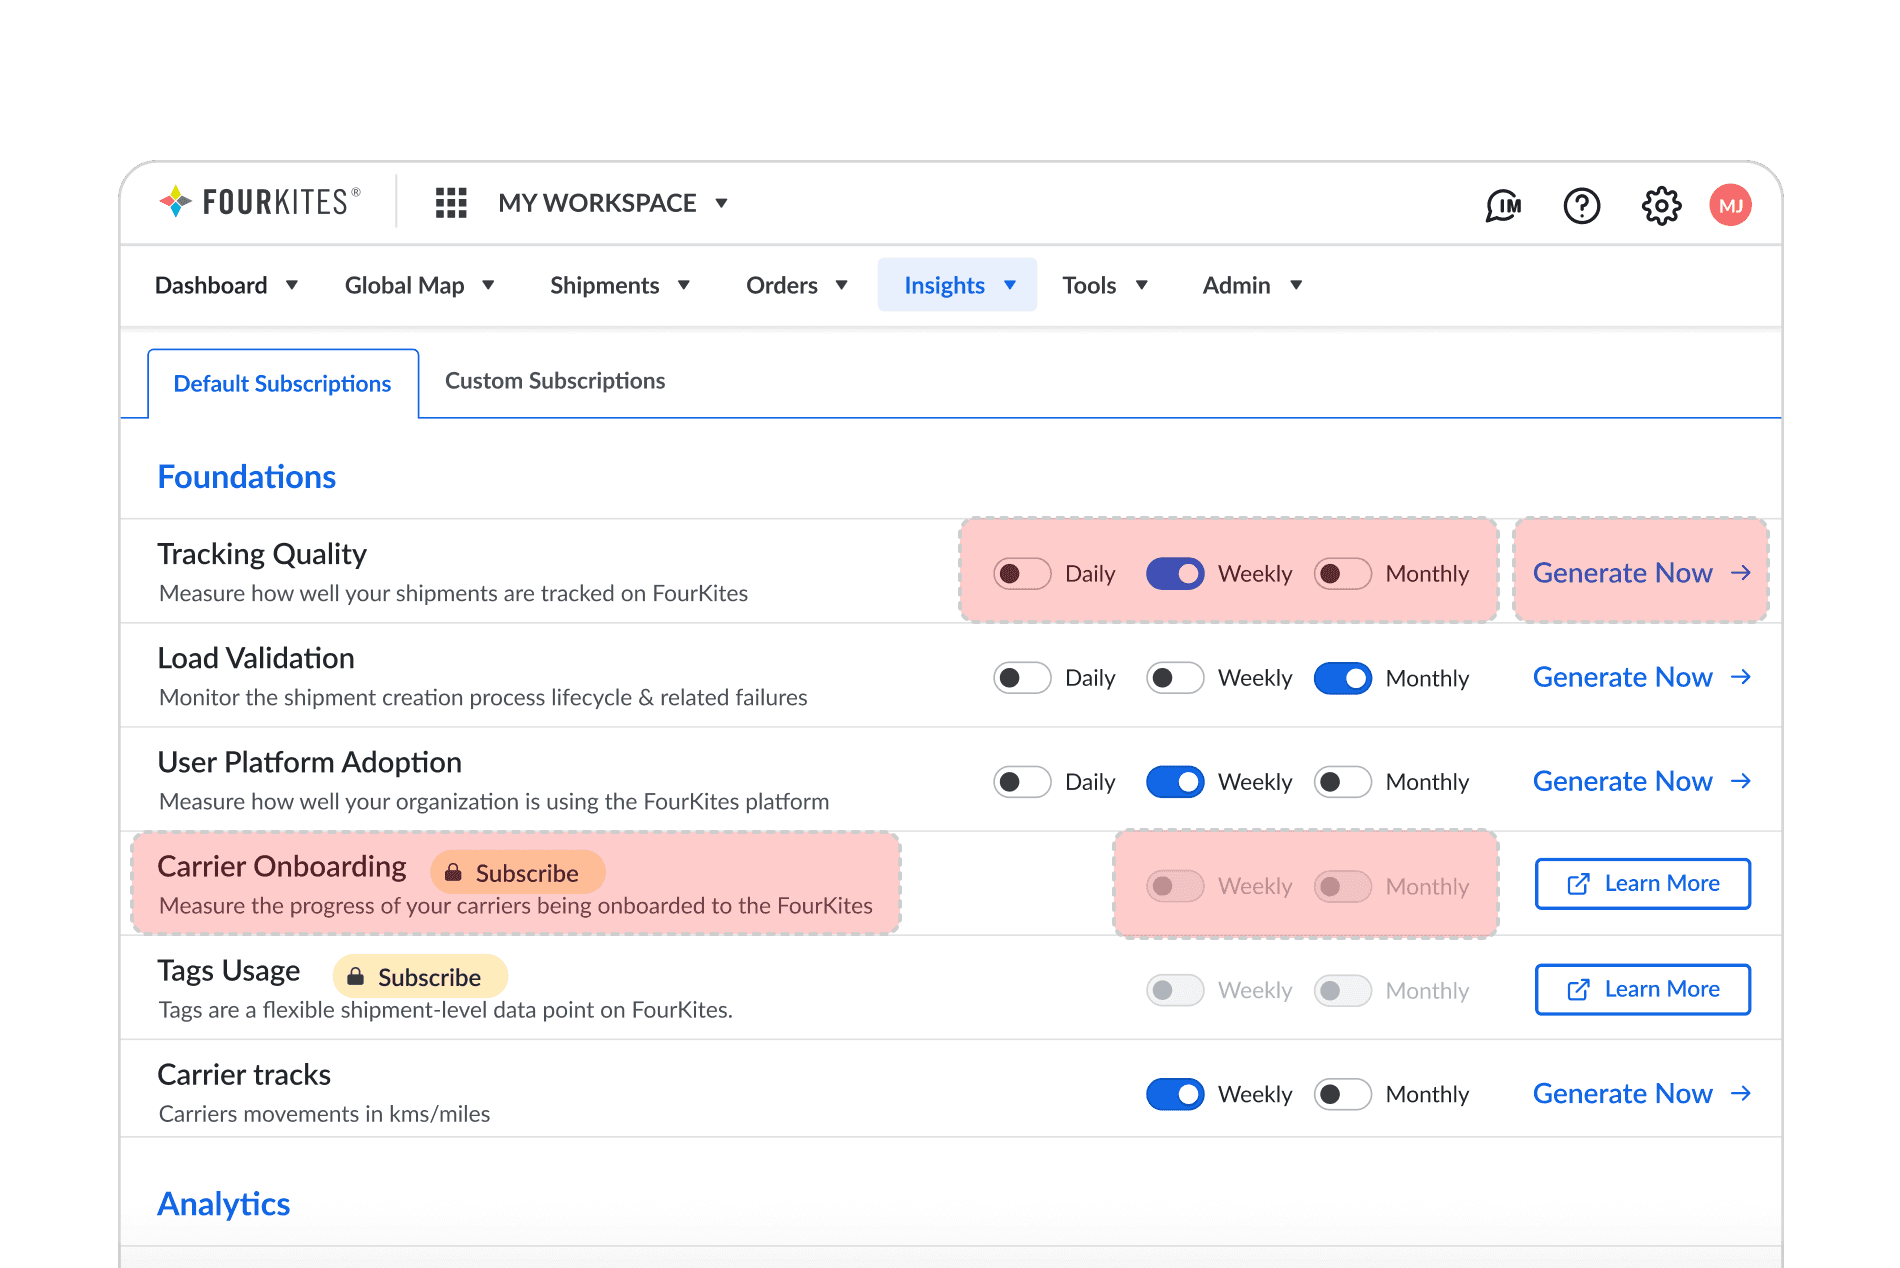
Clicks
Requires multiple clicks to collect data.
Clicks
Requires multiple clicks to collect data.
Clicks
Requires multiple clicks to collect data.
Toggles
Includes too many toggles to download data.
Toggles
Includes too many toggles to download data.
Toggles
Includes too many toggles to download data.
Illusion
Locked are also visible, causing confusion.
Illusion
Locked are also visible, causing confusion.
Illusion
Locked are also visible, causing confusion.
Extra cost?
Getting data shouldn't have extra cost.
Extra cost?
Getting data shouldn't have extra cost.
Extra cost?
Getting data shouldn't have extra cost.
Filtering from pool of datapoints
Filtering from pool of datapoints
Filtering from pool of datapoints
Direction of design
New design needed to achieve the same goal as existing insights page providing real-time data points and values. But, a key decision I advocated for was to display data upfront, eliminating the need for users to click, download, and compile numbers manually.
Direction of design
New design needed to achieve the same goal as existing insights page providing real-time data points and values. But, a key decision I advocated for was to display data upfront, eliminating the need for users to click, download, and compile numbers manually.
Direction of design
New design needed to achieve the same goal as existing insights page providing real-time data points and values. But, a key decision I advocated for was to display data upfront, eliminating the need for users to click, download, and compile numbers manually.
Gathering the data
The biggest challenge was determining which all point required the most attention. To resolve this, we collaborated with PMs, data analysts, and dozens of customers to identify the most requested, searched, and critical data for decision-making.
Gathering the data
The biggest challenge was determining which all point required the most attention. To resolve this, we collaborated with PMs, data analysts, and dozens of customers to identify the most requested, searched, and critical data for decision-making.
Gathering the data
The biggest challenge was determining which all point required the most attention. To resolve this, we collaborated with PMs, data analysts, and dozens of customers to identify the most requested, searched, and critical data for decision-making.
Prioritising
The key solution was to prioritize money and time-related data, as customers heavily relied on these for decision.
Prioritising
The key solution was to prioritize money and time-related data, as customers heavily relied on these for decision.
Prioritising
The key solution was to prioritize money and time-related data, as customers heavily relied on these for decision.
Initial iterations of the report / dashboard
Initial iterations of the report / dashboard
Initial iterations of the report / dashboard
Iterations
Understanding the basic needs, aims, goals and issues, a set of new iterations were framed with the intend to get as close to solution as possible in little time.
Iterations
Understanding the basic needs, aims, goals and issues, a set of new iterations were framed with the intend to get as close to solution as possible in little time.
Iterations
Understanding the basic needs, aims, goals and issues, a set of new iterations were framed with the intend to get as close to solution as possible in little time.

Personalization - A little different Visuals
Personalization - A little different Visuals
Personalization - A little different Visuals
Challenge 1 - Still partially manual
The data-driven UI met expectations and received positive internal feedback, but with suggestions for improvement. While the design made its goals, it still, required users to extract data manually for reporting.\
Challenge 1 - Still partially manual
The data-driven UI met expectations and received positive internal feedback, but with suggestions for improvement. While the design made its goals, it still, required users to extract data manually for reporting.\
Challenge 1 - Still partially manual
The data-driven UI met expectations and received positive internal feedback, but with suggestions for improvement. While the design made its goals, it still, required users to extract data manually for reporting.\
Challenge 2 - Lack of personalisation
A second challenge arose: the design lacked a personal touch. Internal PMs and the tea wanted it to feel more personal, not just another dashboard.
Challenge 2 - Lack of personalisation
A second challenge arose: the design lacked a personal touch. Internal PMs and the tea wanted it to feel more personal, not just another dashboard.
Challenge 2 - Lack of personalisation
A second challenge arose: the design lacked a personal touch. Internal PMs and the tea wanted it to feel more personal, not just another dashboard.
An opportunity in challenge
While making things personalized required us to change our design and was tough to achieve for 120+ customers, it brought in an entire different set of opportunities and benefits to the company and the design team.
An opportunity in challenge
While making things personalized required us to change our design and was tough to achieve for 120+ customers, it brought in an entire different set of opportunities and benefits to the company and the design team.
An opportunity in challenge
While making things personalized required us to change our design and was tough to achieve for 120+ customers, it brought in an entire different set of opportunities and benefits to the company and the design team.
Explore
Exploration of more patterns and visuals.
Explore
Exploration of more patterns and visuals.
Explore
Exploration of more patterns and visuals.
Systems
Possibility of creating system for product.
Systems
Possibility of creating system for product.
Systems
Possibility of creating system for product.
Compete
It could give us a competitive edge.
Compete
It could give us a competitive edge.
Compete
It could give us a competitive edge.
Revenue
New product could be sold to up the revenue.
Revenue
New product could be sold to up the revenue.
Revenue
New product could be sold to up the revenue.
Updated design - bento box widgets
Updated design - bento box widgets
Updated design - bento box widgets
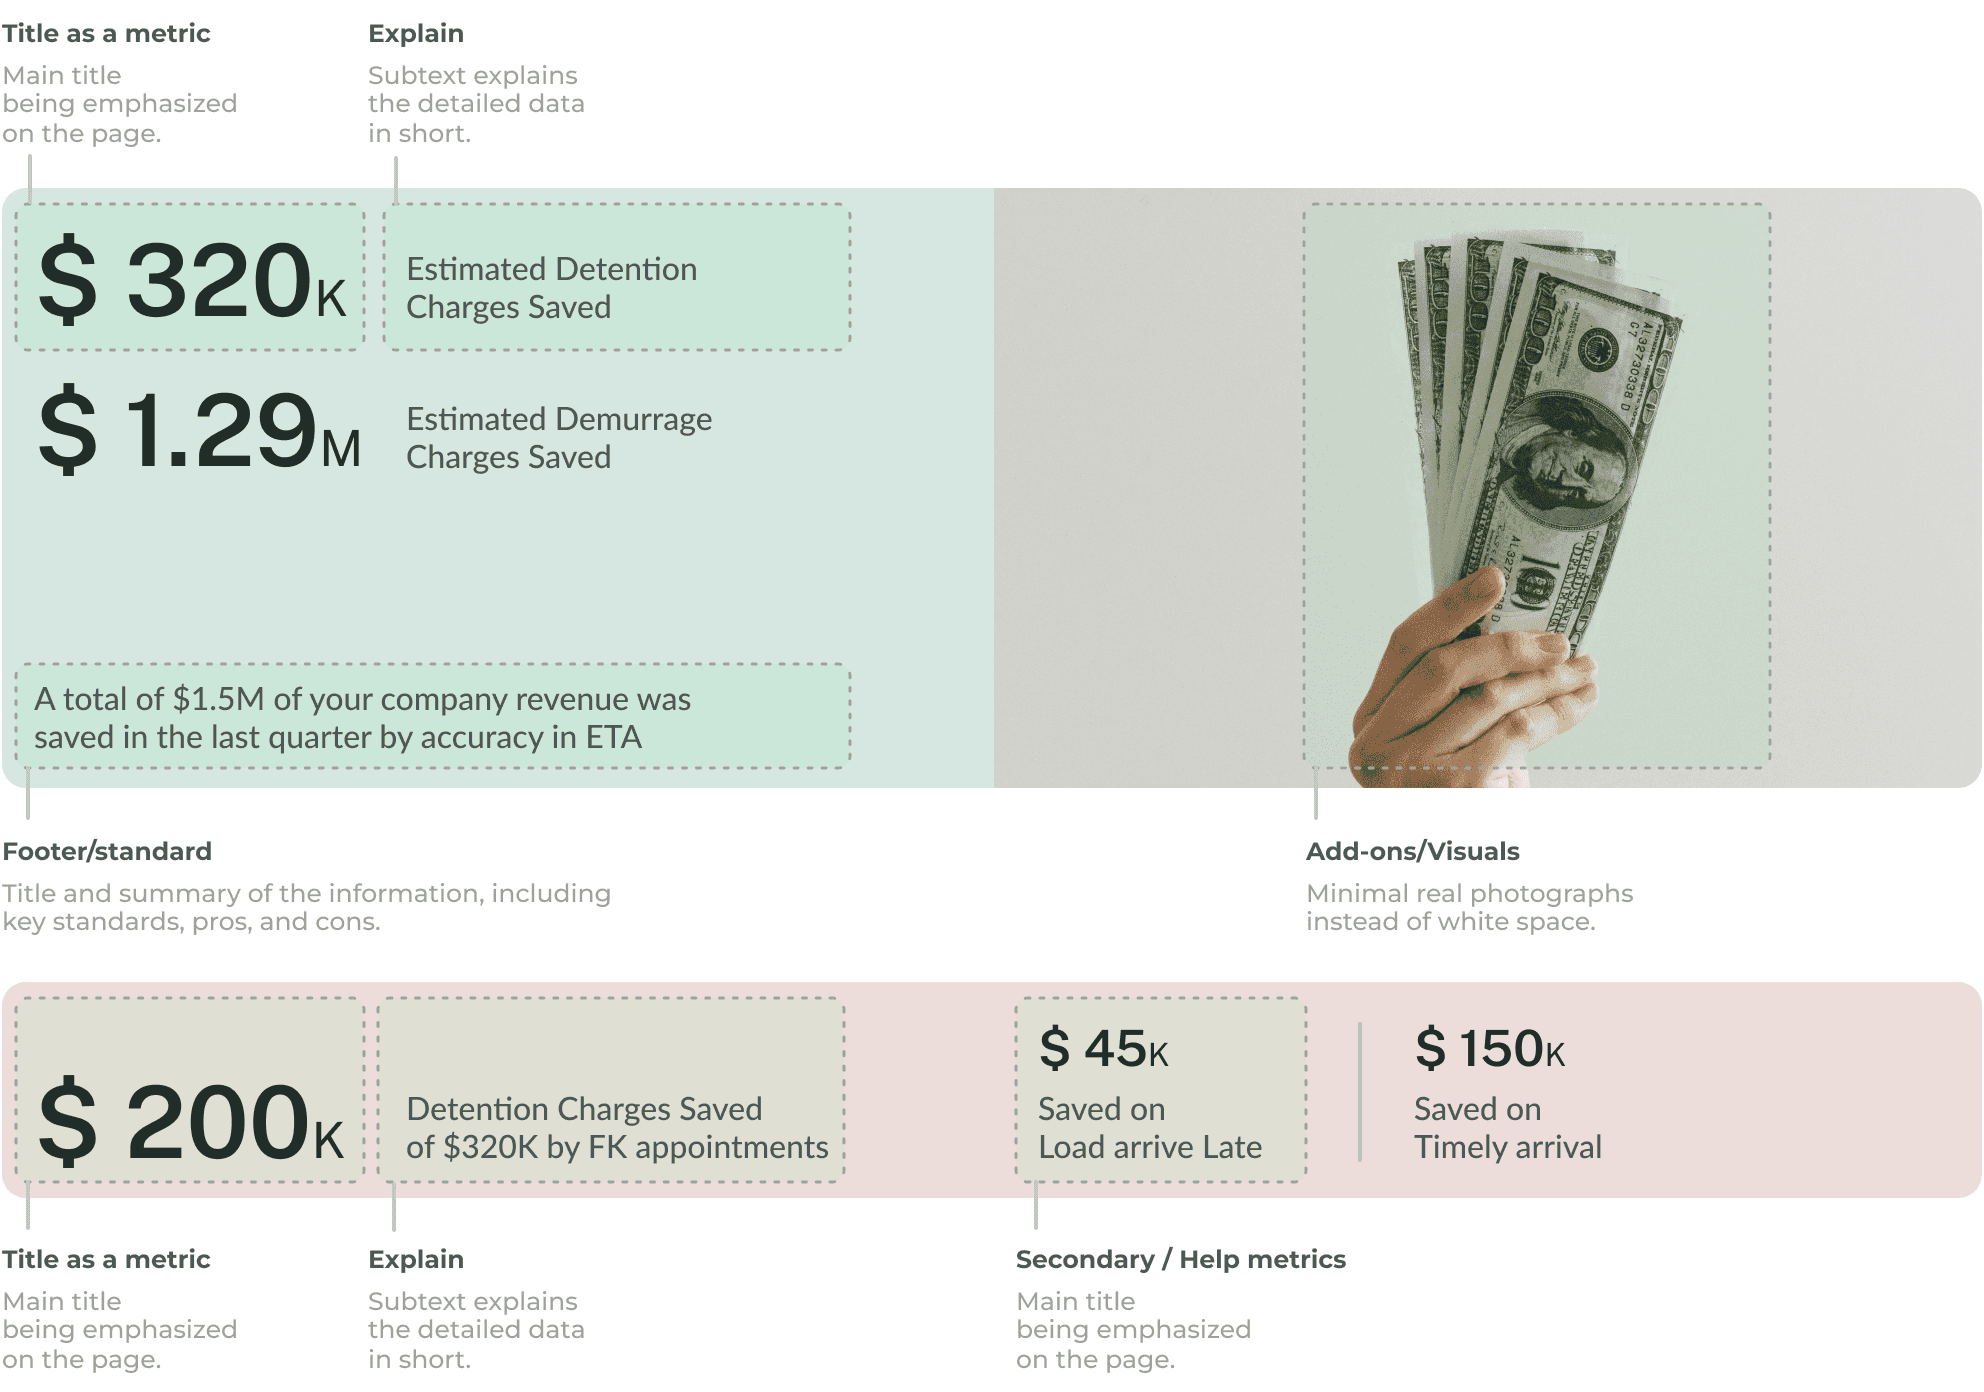
Solution
I designed a bento box layout with a simple, data-centric visual language, offering a clear and scannable interface. This modular design enhances adaptability for future data points and versions.
Solution
I designed a bento box layout with a simple, data-centric visual language, offering a clear and scannable interface. This modular design enhances adaptability for future data points and versions.
Solution
I designed a bento box layout with a simple, data-centric visual language, offering a clear and scannable interface. This modular design enhances adaptability for future data points and versions.

Widget bento style
Each box had the dominant value / number that brought its value in the design. The value had a subtext with it, and also a benchmark or standard of FK values with other competitors (without showing much data).
Widget bento style
Each box had the dominant value / number that brought its value in the design. The value had a subtext with it, and also a benchmark or standard of FK values with other competitors (without showing much data).
Widget bento style
Each box had the dominant value / number that brought its value in the design. The value had a subtext with it, and also a benchmark or standard of FK values with other competitors (without showing much data).
Automating things for 9:00 am emails
Automating things for 9:00 am emails
Automating things for 9:00 am emails
Why send email ?
The entire report was to be prepared in a pdf. While this was decided to stay within the Insight page, it was also necessary for it to be sent to user directly to enhance a personal touch.
Why send email ?
The entire report was to be prepared in a pdf. While this was decided to stay within the Insight page, it was also necessary for it to be sent to user directly to enhance a personal touch.
Why send email ?
The entire report was to be prepared in a pdf. While this was decided to stay within the Insight page, it was also necessary for it to be sent to user directly to enhance a personal touch.
Automation by means of A.I.
Manually sending emails at a fixed time was inefficient. To solve this, we automated email creation and delivery using backend data and a bit of A.I, eliminating manual effort. Due to constraints, new designs weren’t feasible, but automation streamlined the process, saving time and resources.
Final Design
Final Design
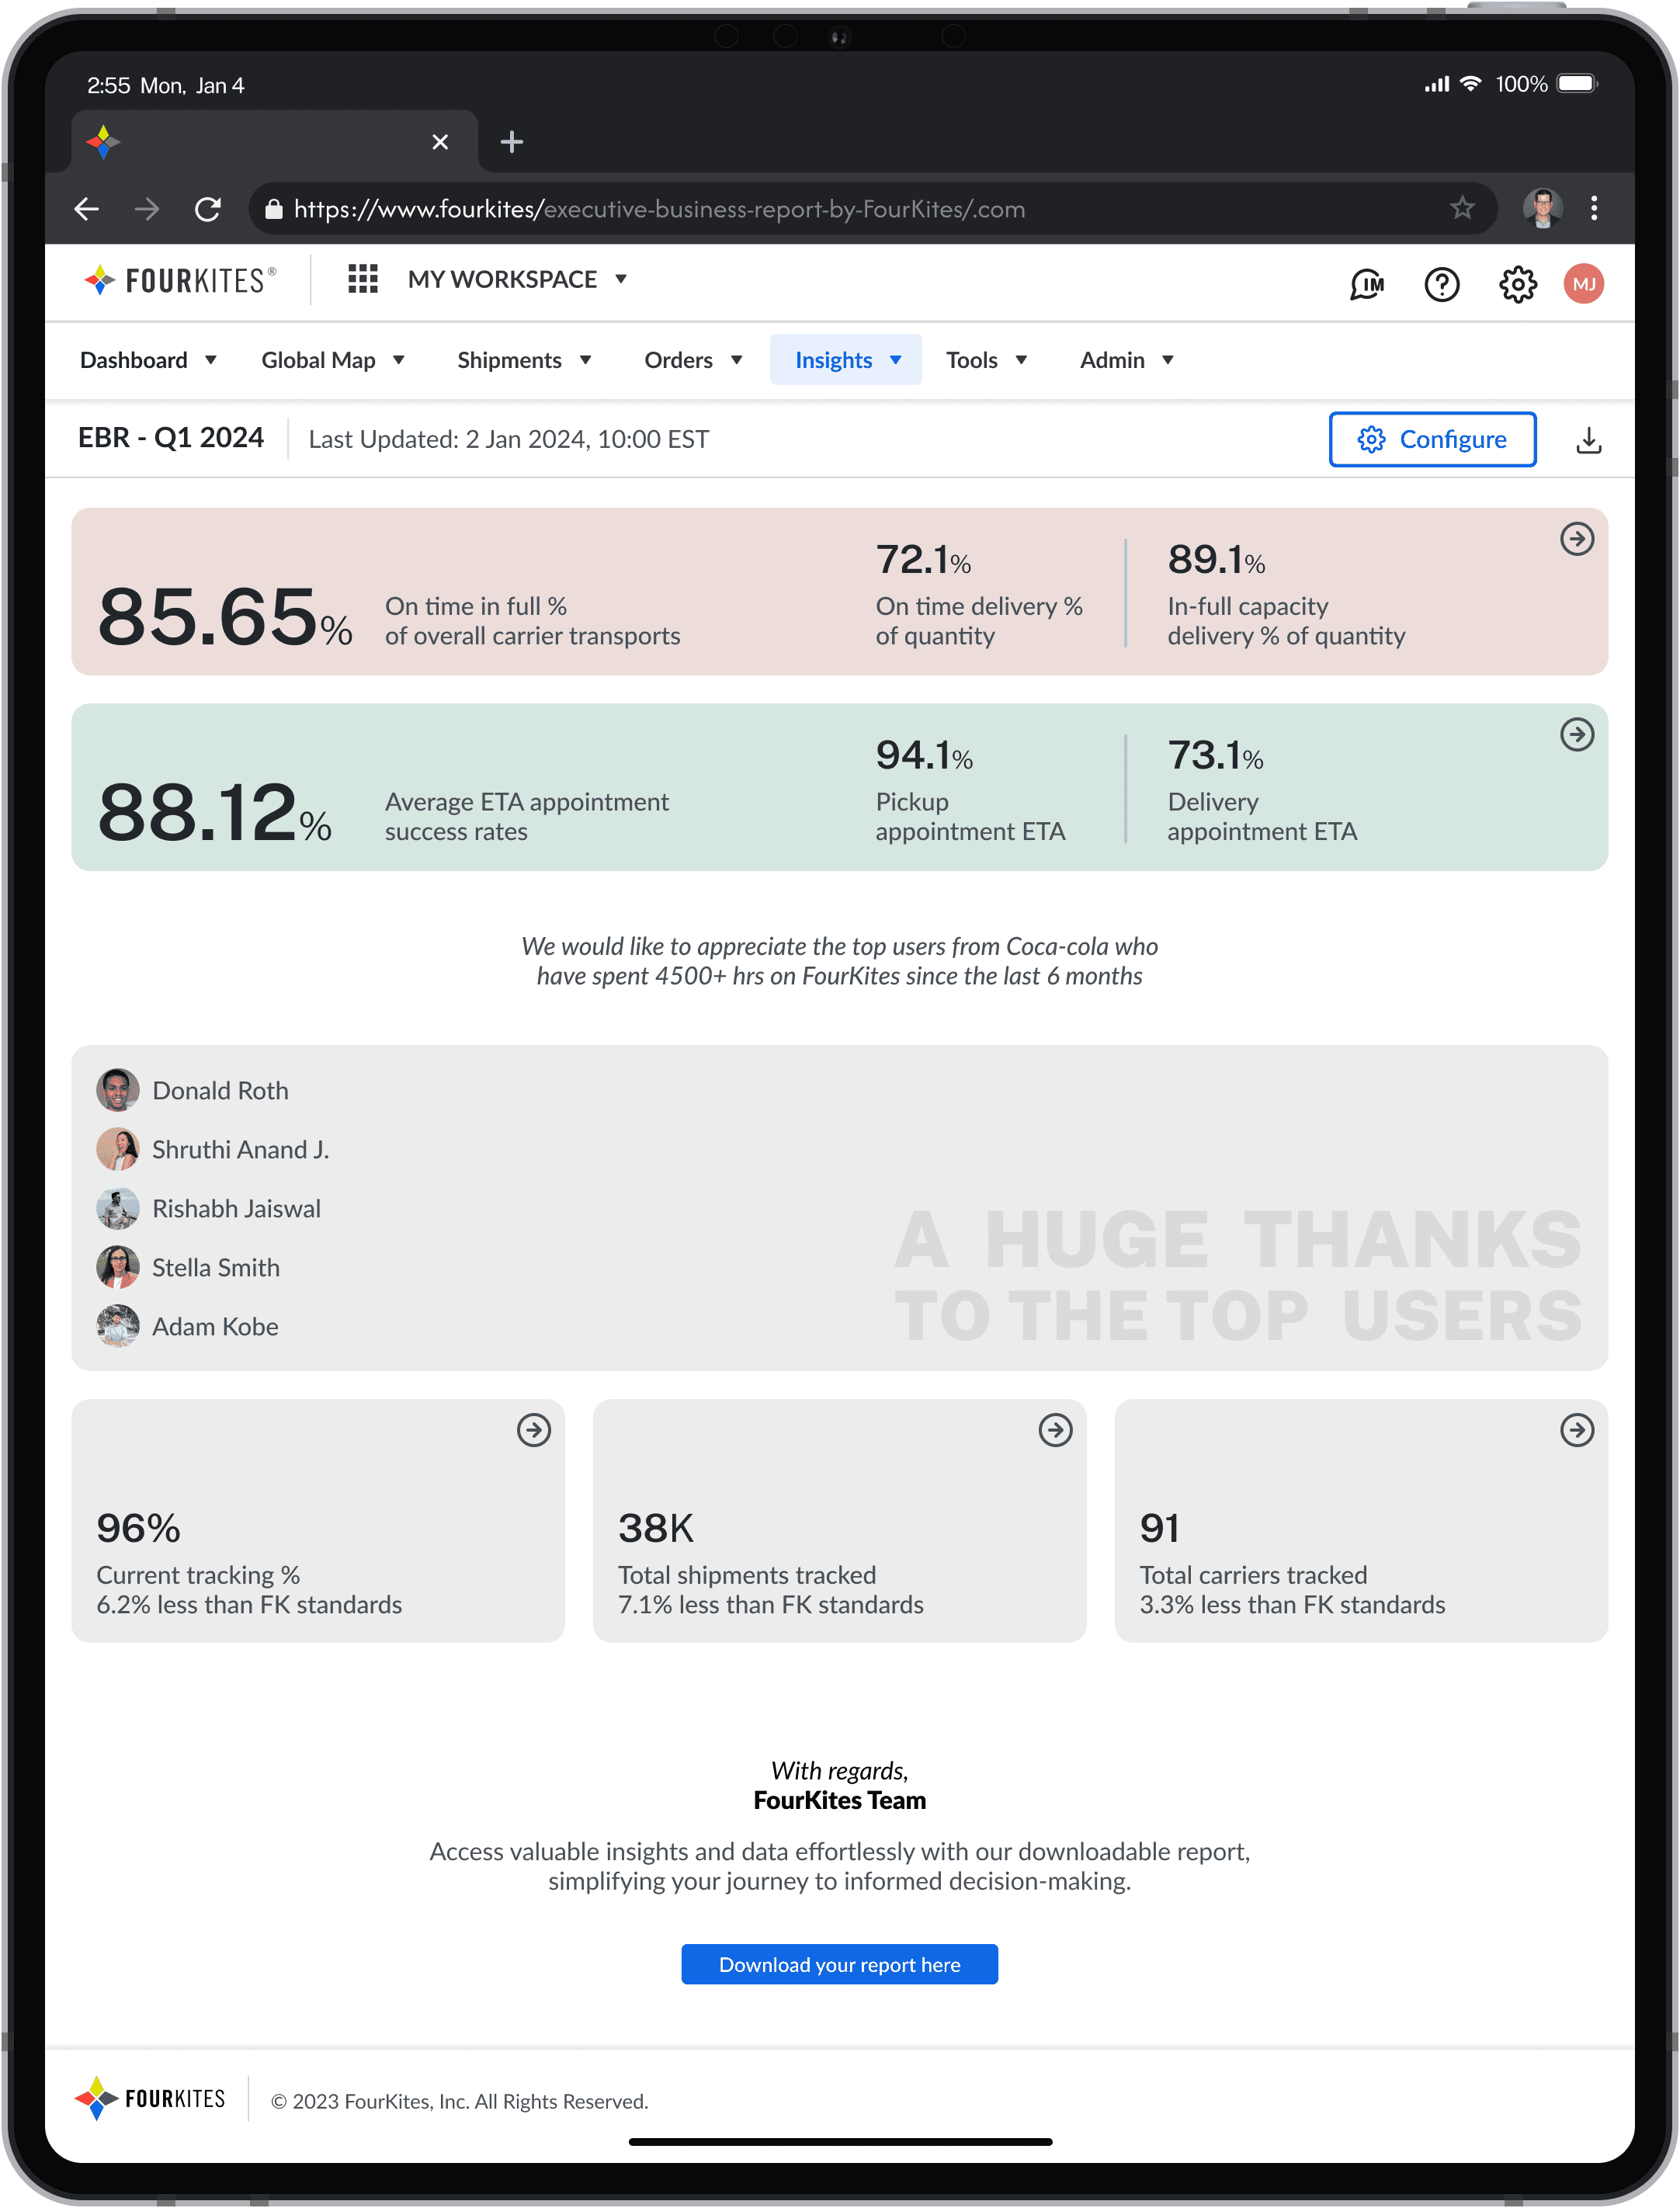
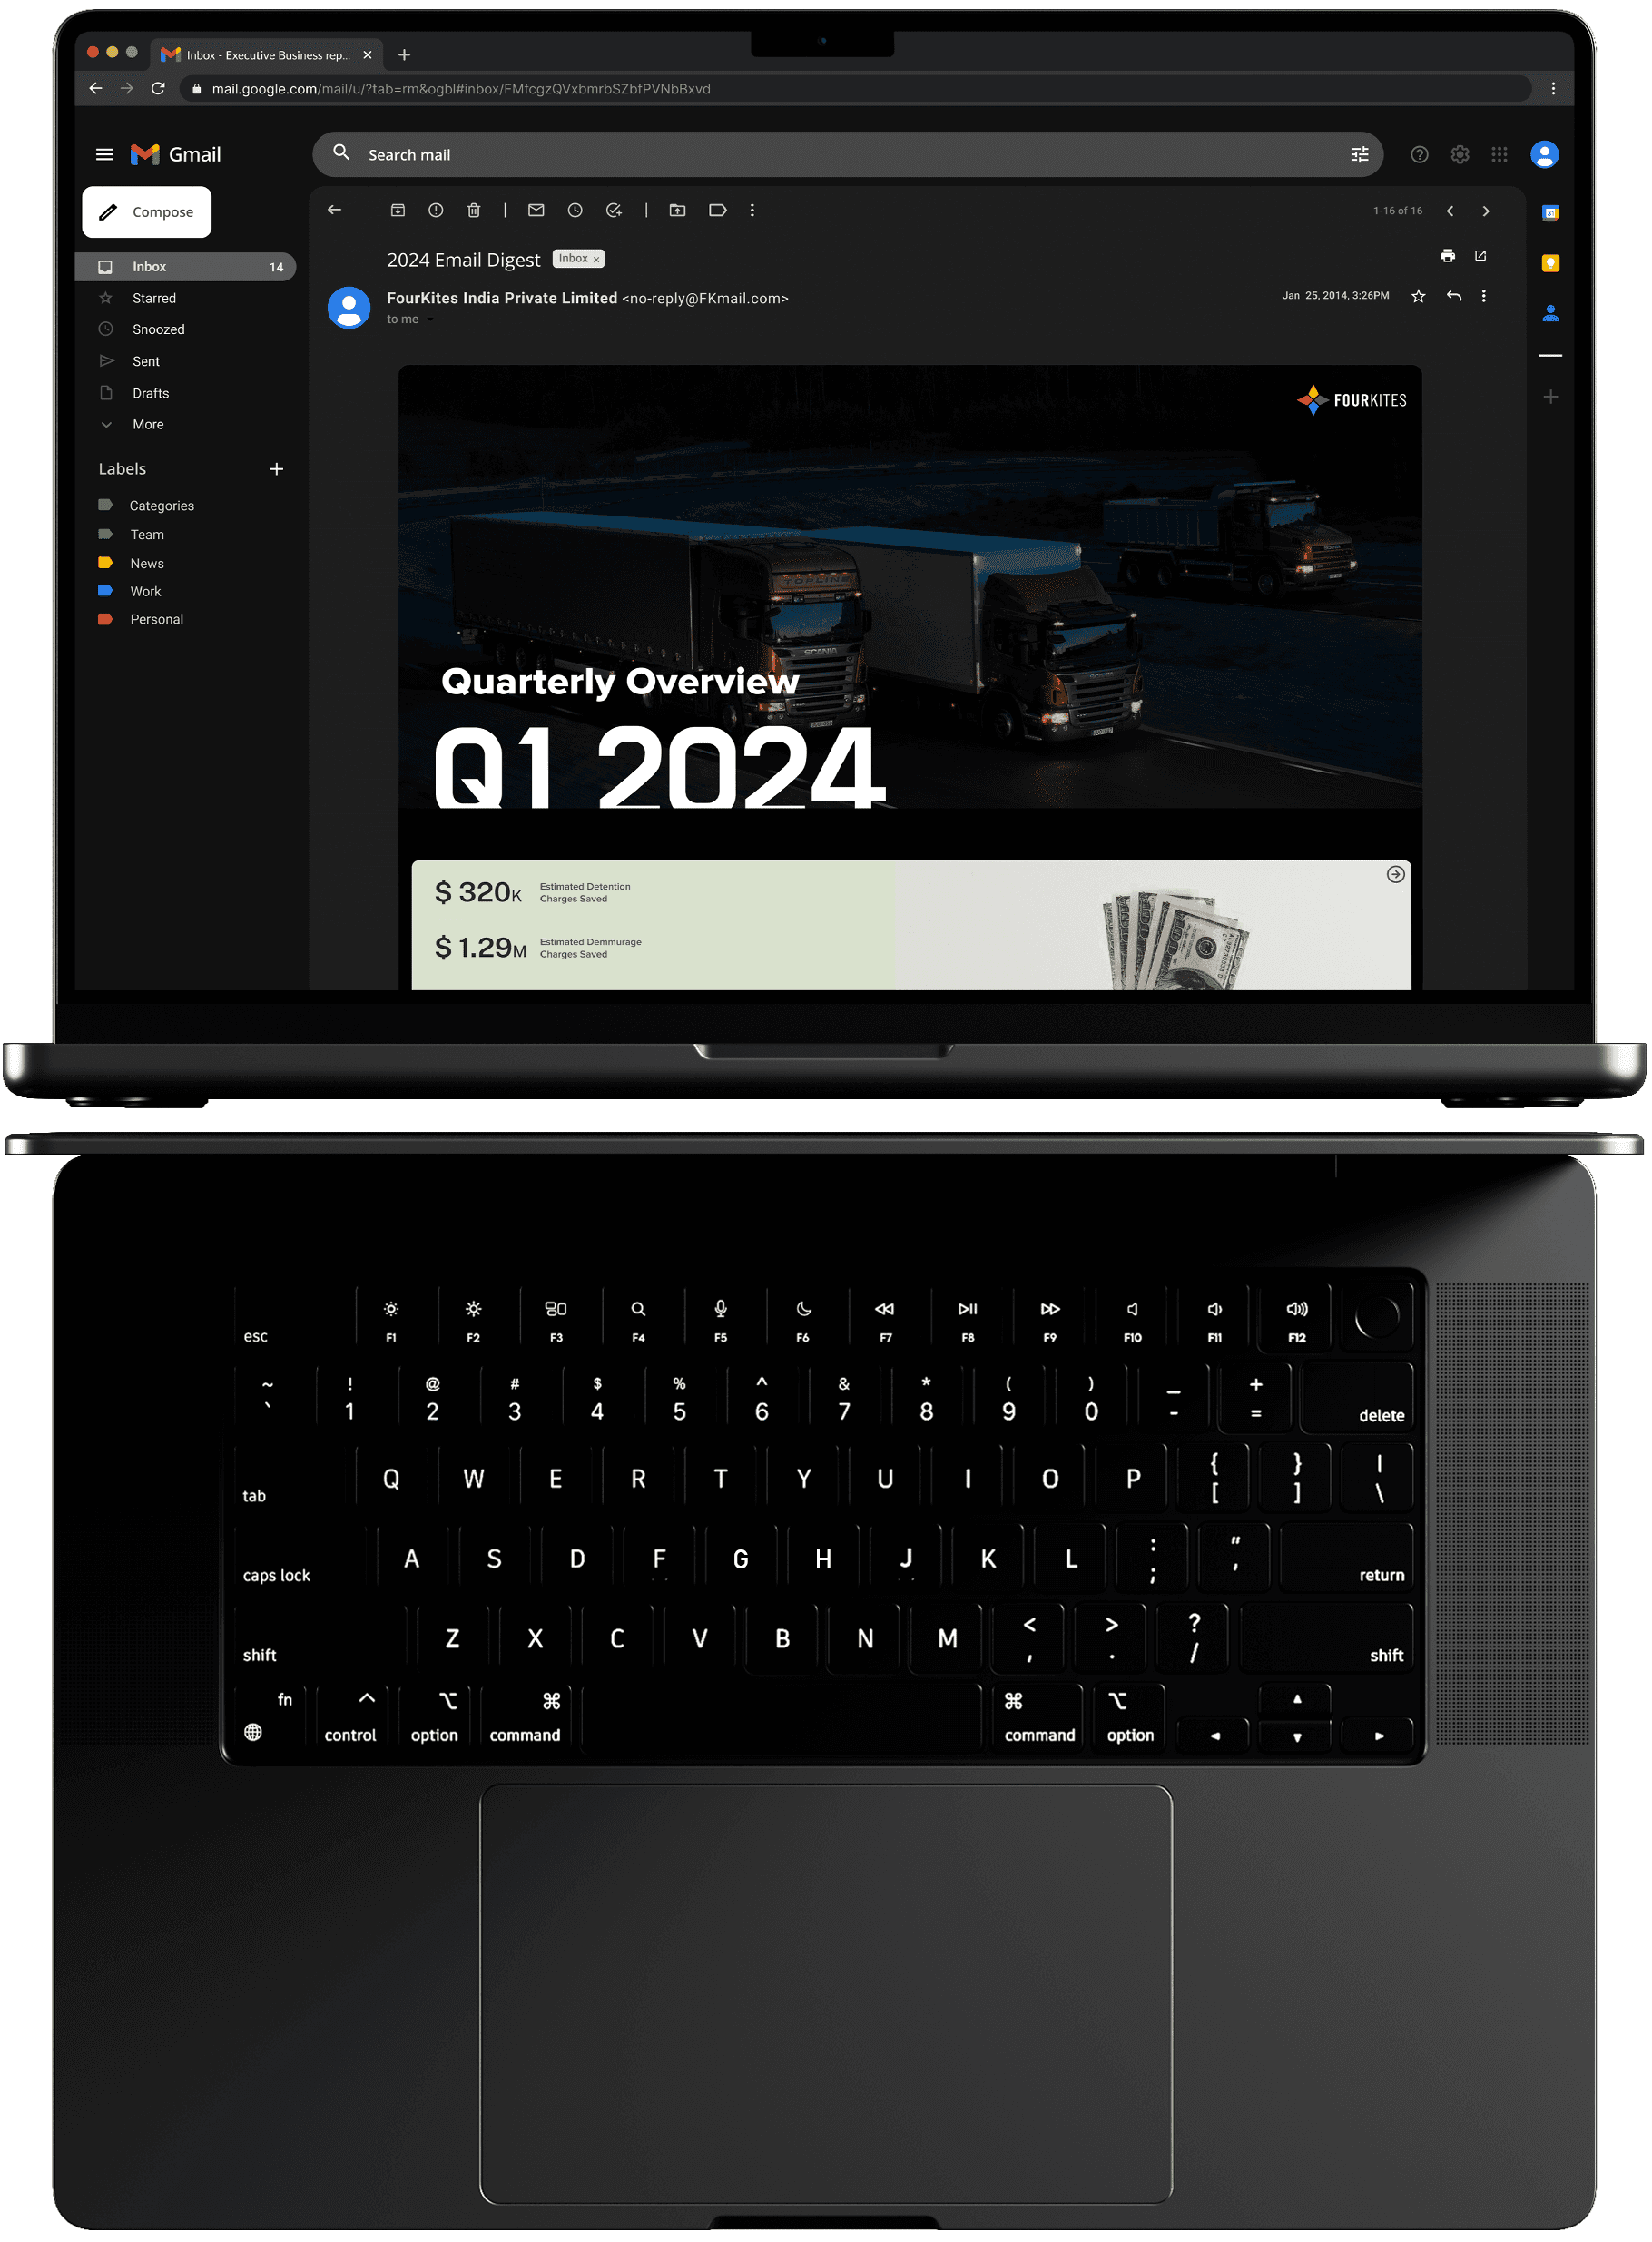
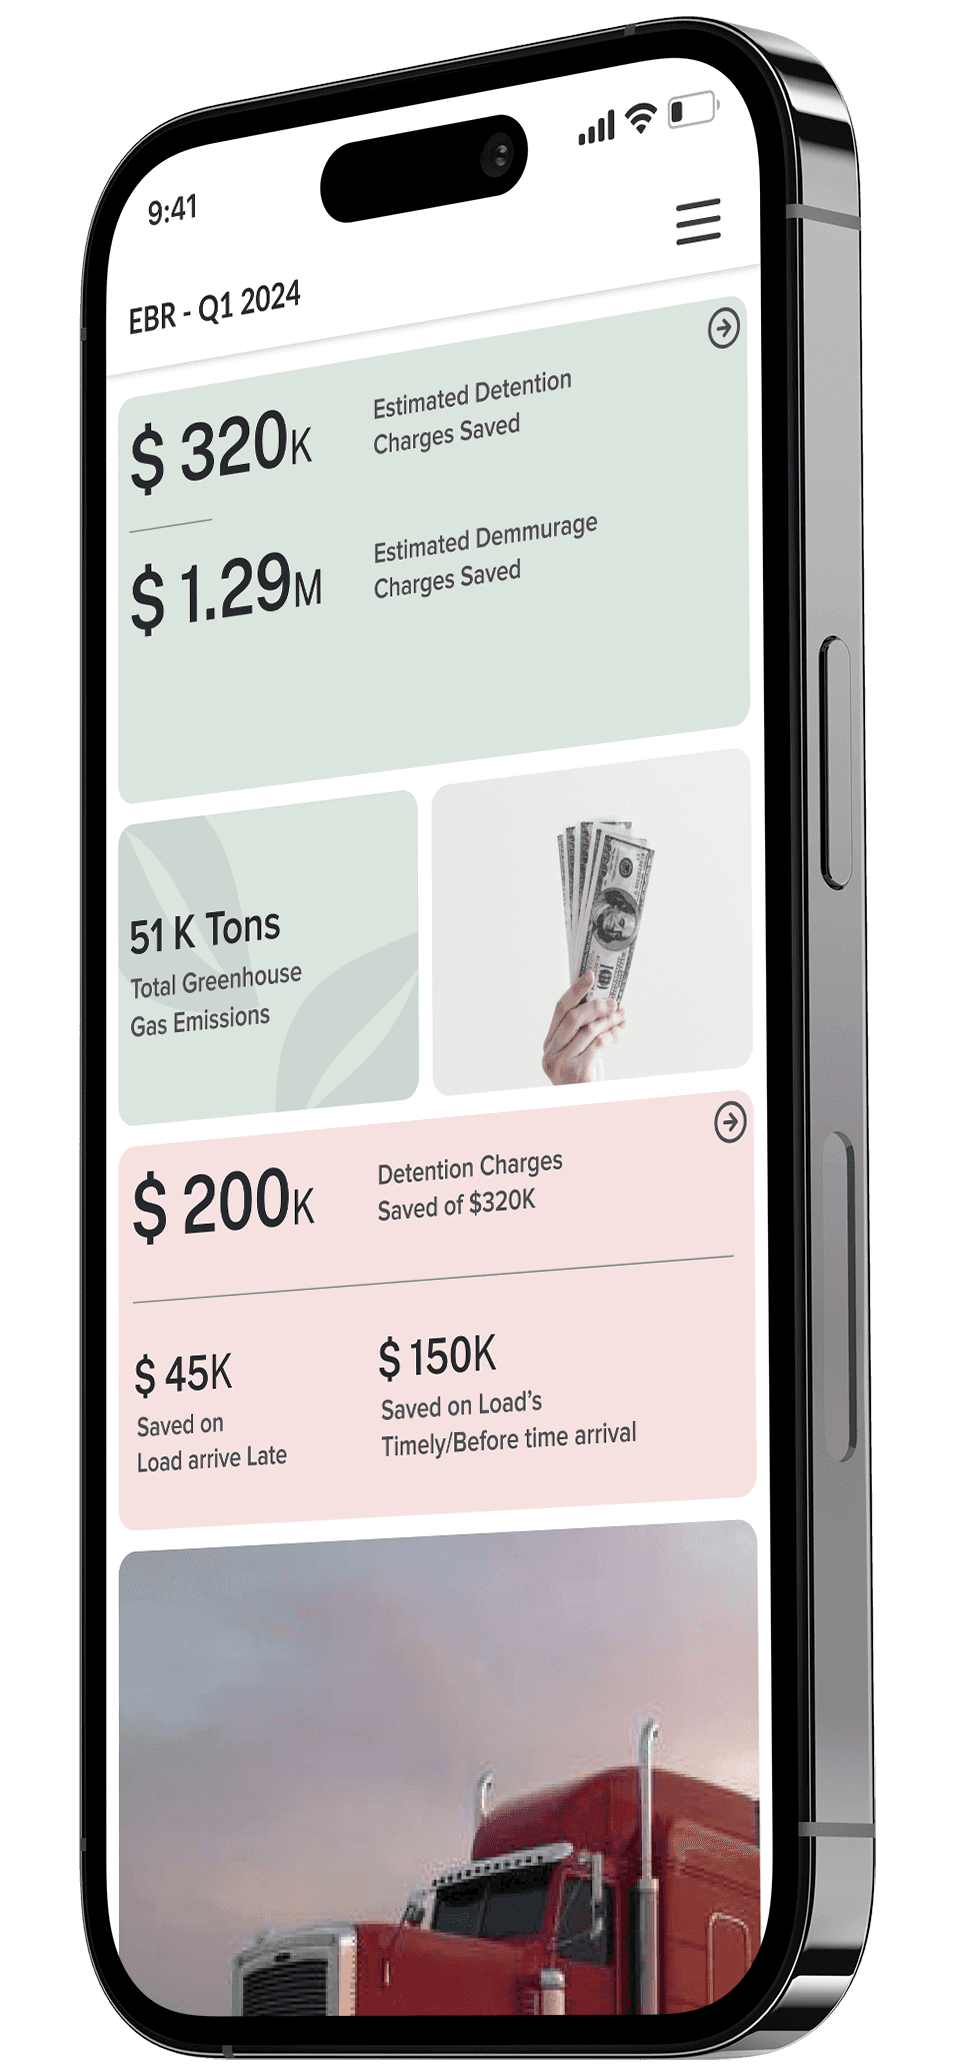
Simplified automated report
An automated system to create and email reports directly to customers, eliminating the need for users to create them manually.
Simplified automated report
An automated system to create and email reports directly to customers, eliminating the need for users to create them manually.
Simplified automated report
An automated system to create, and mail the reports directly to customers, eliminating the need for users to create them manually.
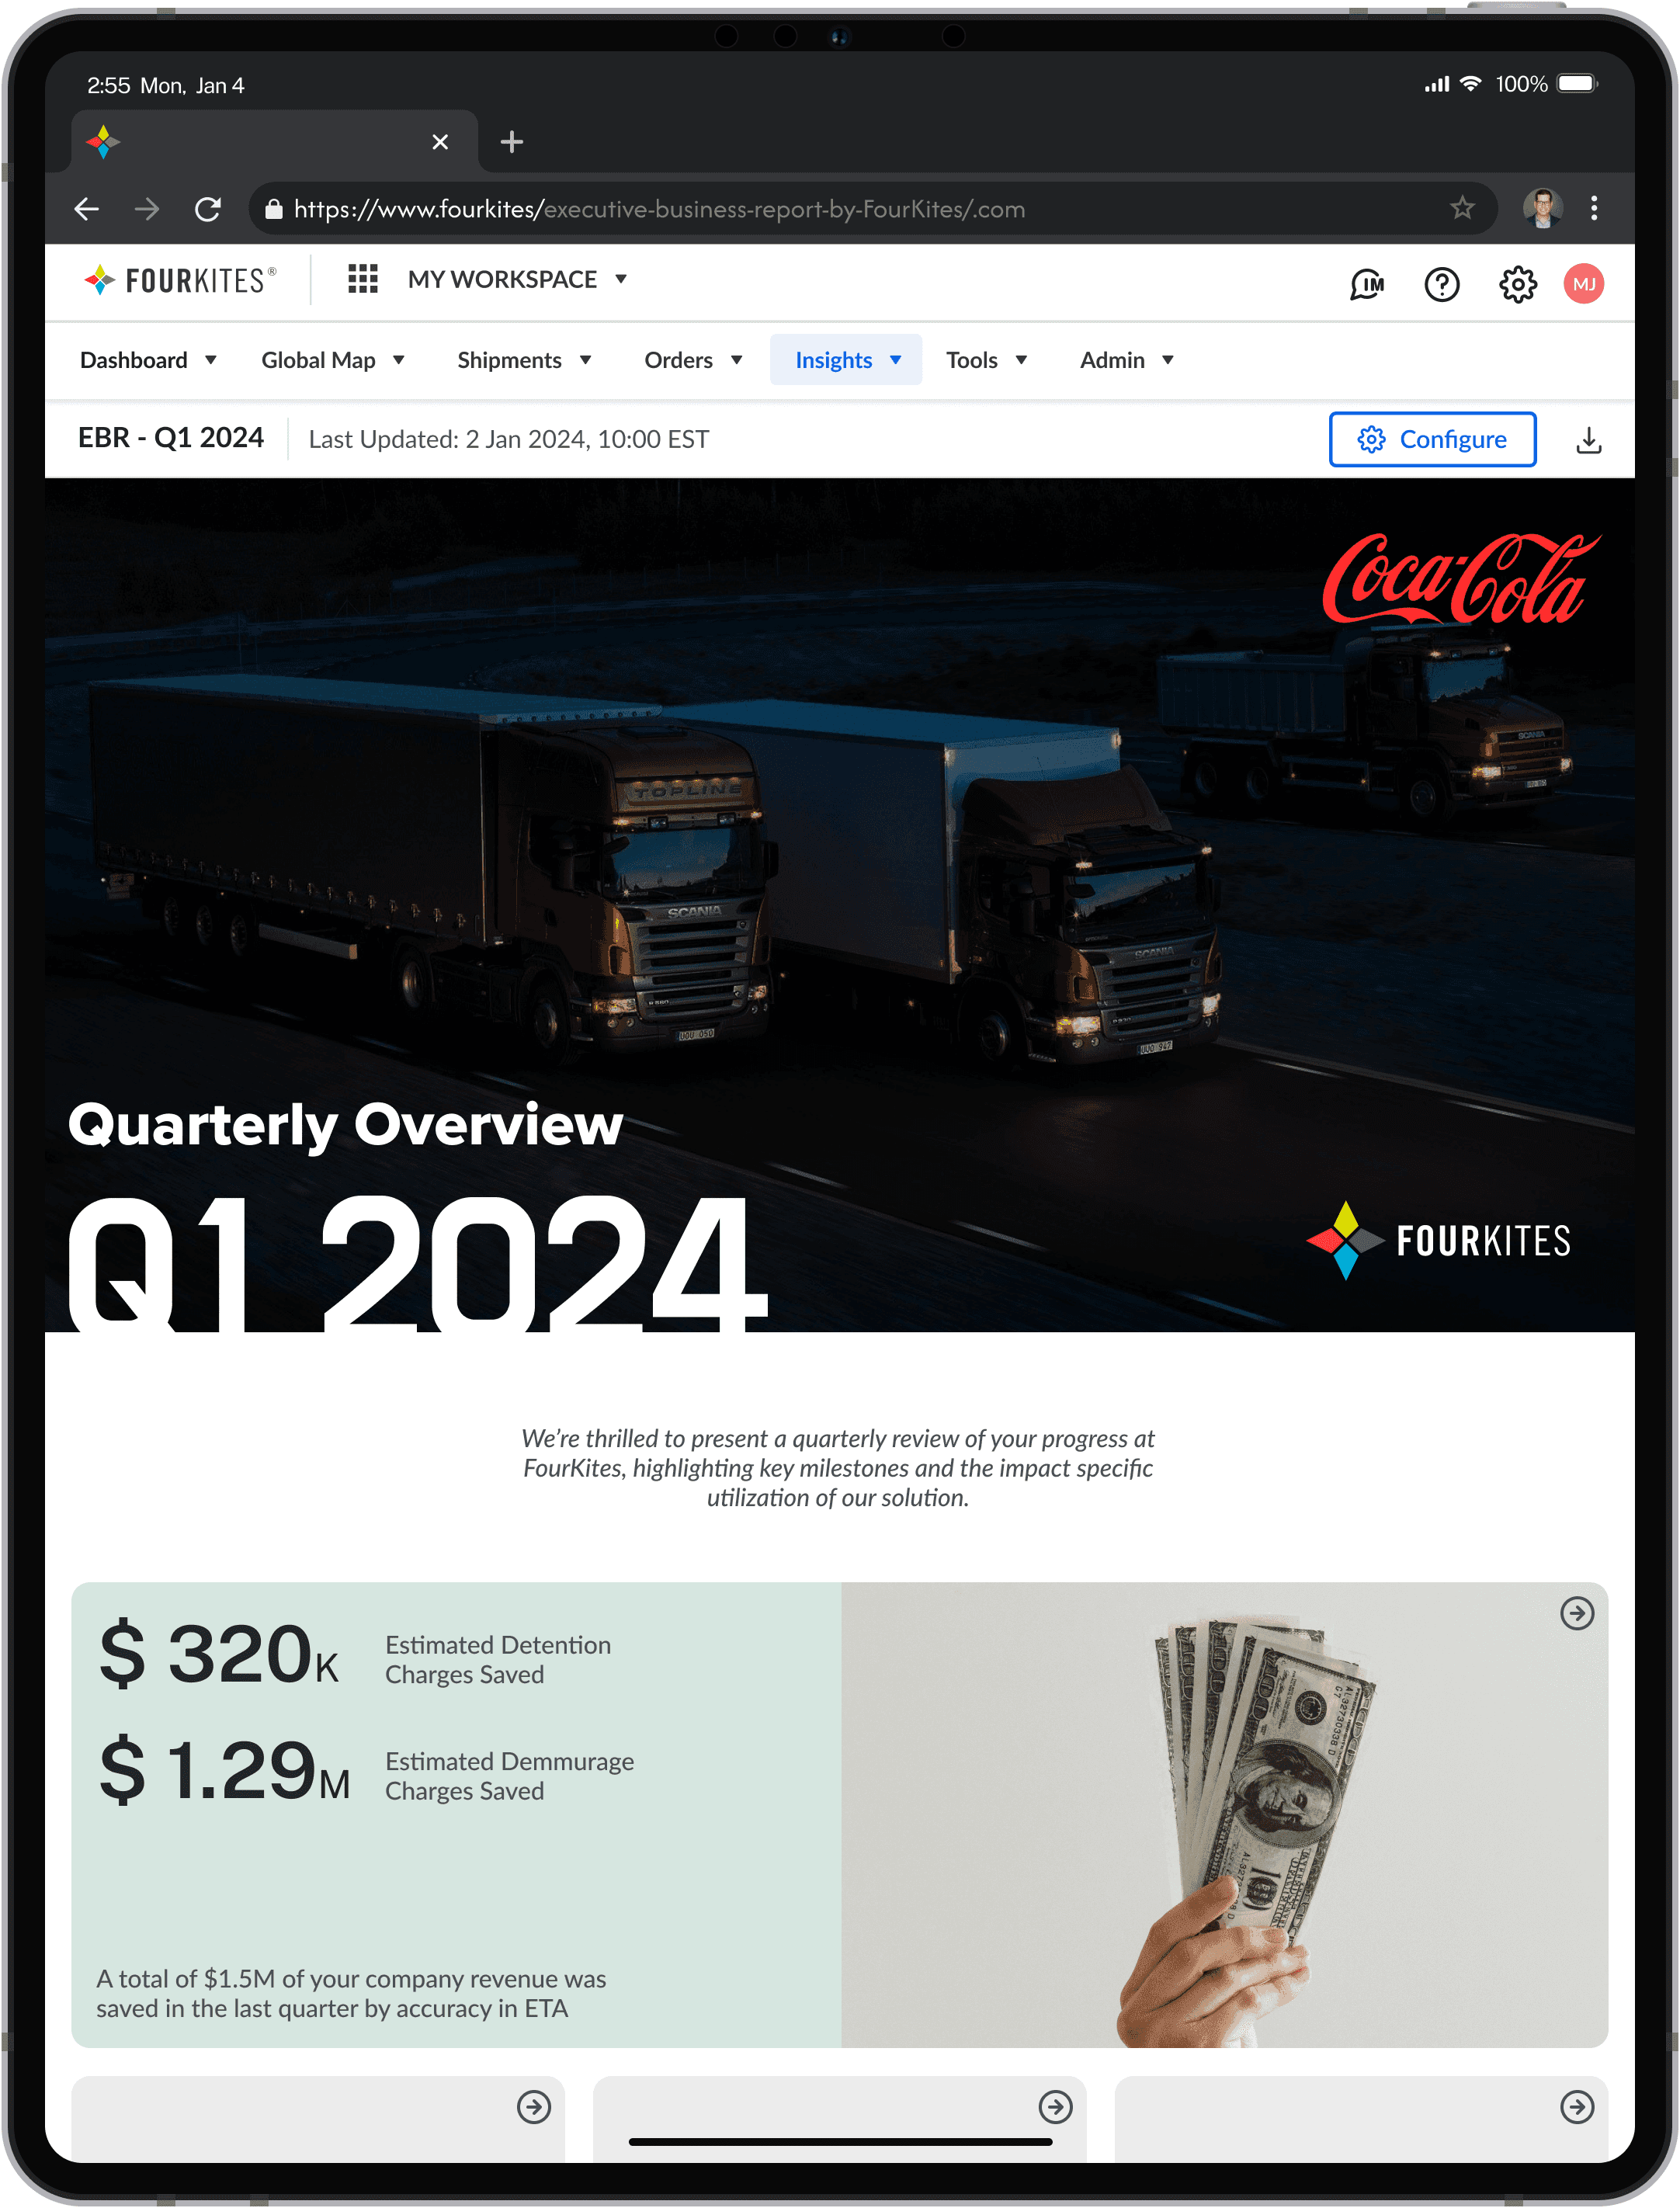

An email at 9:00 AM
Automating emails at 9:00 AM keeps them at the top of unread messages, increasing visibility, CTR% and TOT%
An email at 9:00 AM
Automating emails at 9:00 AM keeps them at the top of unread messages, increasing visibility, CTR% and TOT%
An email at 9:00 AM
Automating emails at 9:00 AM keeps them at the top of unread emails, increasing visibility, CTR% and TOT%
And ofcourse, Its responsive
And ofcourse, Its responsive
And ofcourse, Its responsive

Impact and the Lessons
Impacts
Noticing the users, I learned that not all problems are always reported, and solutions are not always within the products. In this case, a simple 9 am email solved the issue without altering the system and simplified the experiences even for those users who were unaware of the problem.
Noticing the users, I learned that not all problems are always reported, and solutions are not always within the products. In this case, a simple 9 am email solved the issue without altering the system and simplified the experiences even for those users who were unaware of the problem.
Not all the problems are always seen, and not all solutions needs a product redesign. In this design case, a simple 9: 00 am email resolved the problem and improved the UX.
Contract renewal times reduced to 2-3 Days from 6+ days
6 days
to
2 days
66 %
in 60 days
Contract renewal times reduced to 2-3 Days from 6+ days
6 days
to
2 days
66 %
in 60 days
Contract renewal times reduced to 2-3 Days from 6+ days
6 days
to
2 days
66 %
in 60 days
Report size reduced to 2 or 3 pages instead of 8 to 20 pages manual.
8-20
Pages to
2
75 % - 85 %
in 60 days
Report size reduced to 2 or 3 pages instead of 8 to 20 pages manual.
8-20
Pages to
2
75 % - 85 %
in 60 days
Report size reduced to 2 or 3 pages instead of 8 to 20 pages manual.
8-20
Pages to
2
75 % - 85 %
in 60 days
It was a little more chaotic process. Curious? Let’s talk. 🤓
It was a little more chaotic process. Curious? Let’s talk. 🤓
Wanna know more? Let’s talk. 🤓